The Fifa Women’s World Cup has reached the end of the first round of games. In the last few games we saw a few what appeared to be almost one sided affairs, with Canada vs Cameroon, New Zealand vs the Netherlands and also in some respects England vs Scotland. So let’s break down these games a little more, but today we are going to have a focus on passing.
Game 1: England vs Scotland
This game saw England come out strong, going in to half-time 2 nil up. Scotland came back strong in the 2nd half to give the English a scare and show they can’t be taken lightly. First up, let’s look at the passing positions in both halfs.
| Team | Half | Total Passes | Successful Passes | Pass Percentage |
|---|---|---|---|---|
| England | 1 | 312 | 260 | 83 |
| England | 2 | 269 | 224 | 83 |
| Scotland | 1 | 148 | 98 | 66 |
| Scotland | 2 | 259 | 220 | 85 |
| a Table 1: Passing summary for England vs Scotland by half |
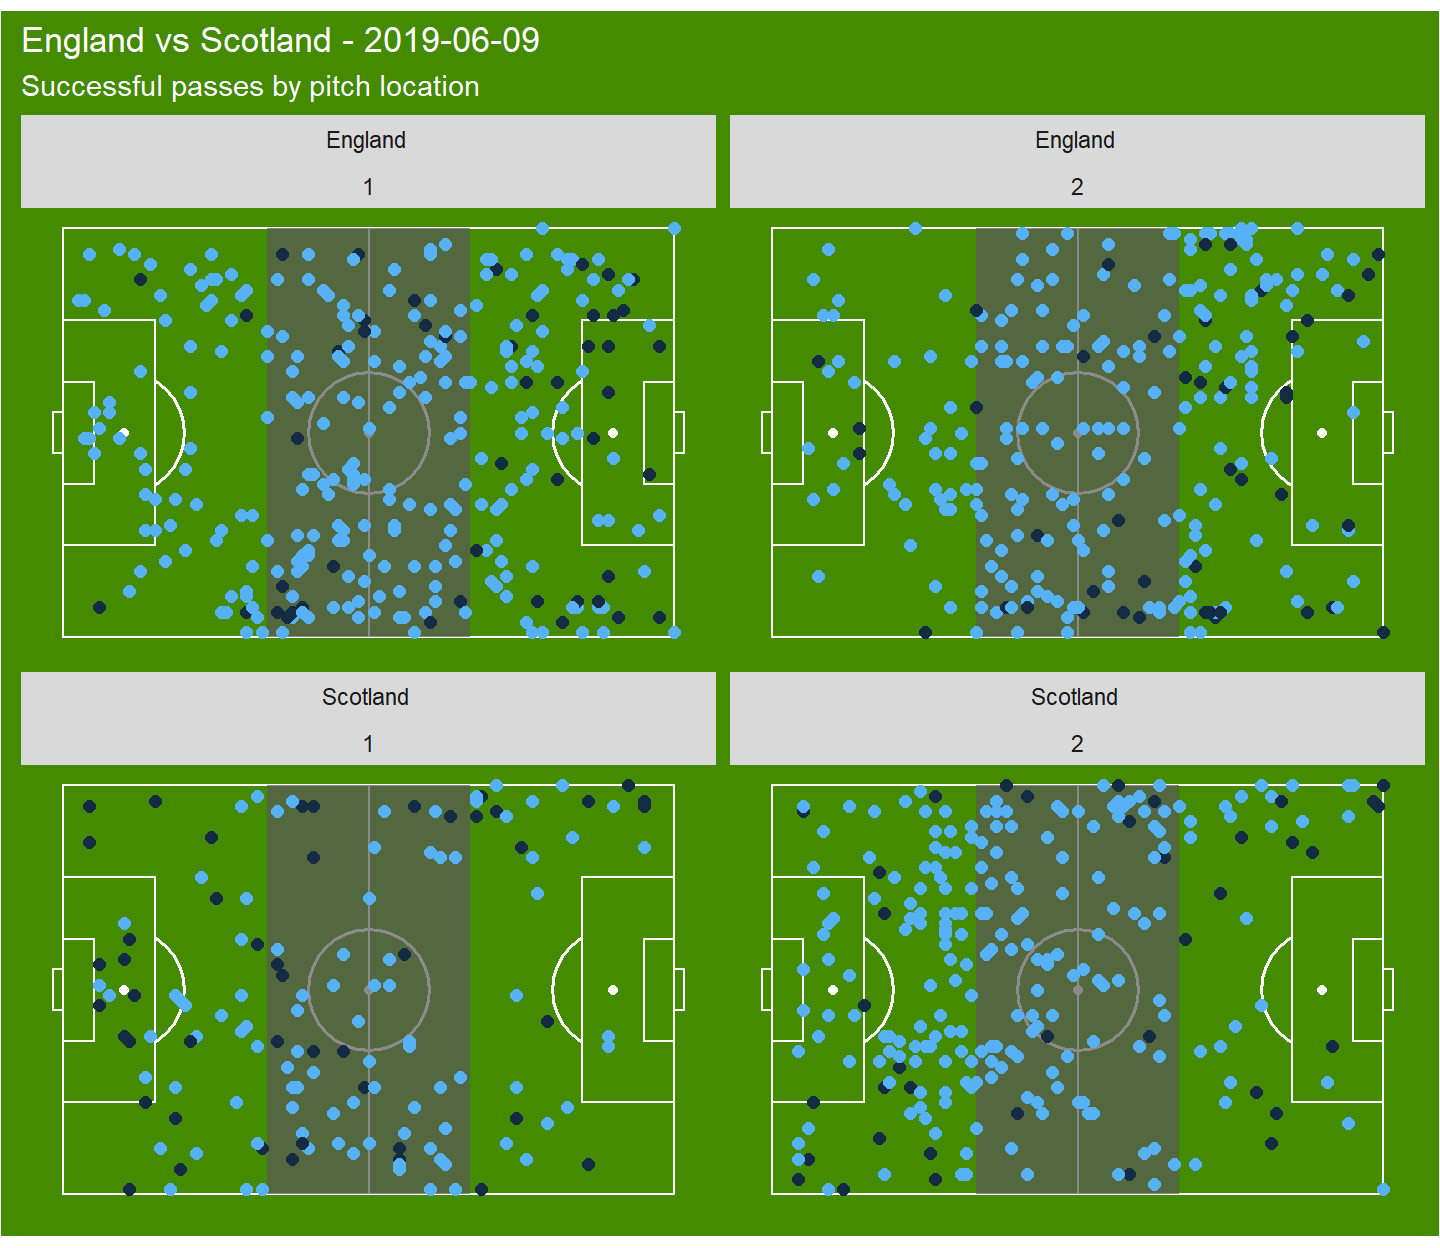
We can already see from this plot that Scotland didn’t see much of the ball in the first half and were often in their defensive half from what this shows. Their pass percentage improved a lot in the second half which may have helped pull them back in to the match and gave them the ability to create a few more scoring opportunities. In the end they showed they were more than capable of playing on the World stage and that they shouldn’t be taken lightly.
Game 2: Canada vs Cameroon
This game was from a passing perspective was very one-sided, as can be seen in Table 2 below. The game plan for Cameroon consisted of trying to catch Canada on the counter attack. They often tried to play longer passes, attempting 0 passes greater than 25 units in length. We can see this even more in the plot below.
## `summarise()` has grouped output by 'Team'. You can override using the `.groups` argument.| Team | Half | Total Passes | Successful Passes | Pass Percentage | Pass Length (avg) |
|---|---|---|---|---|---|
| Cameroon | 1 | 115 | 64 | 56 | 23.7 |
| Cameroon | 2 | 113 | 55 | 49 | 25.8 |
| Canada | 1 | 321 | 258 | 80 | 19.7 |
| Canada | 2 | 299 | 234 | 78 | 20.4 |
| a Table 2: Passing summary for Canada vs Cameroon by half |
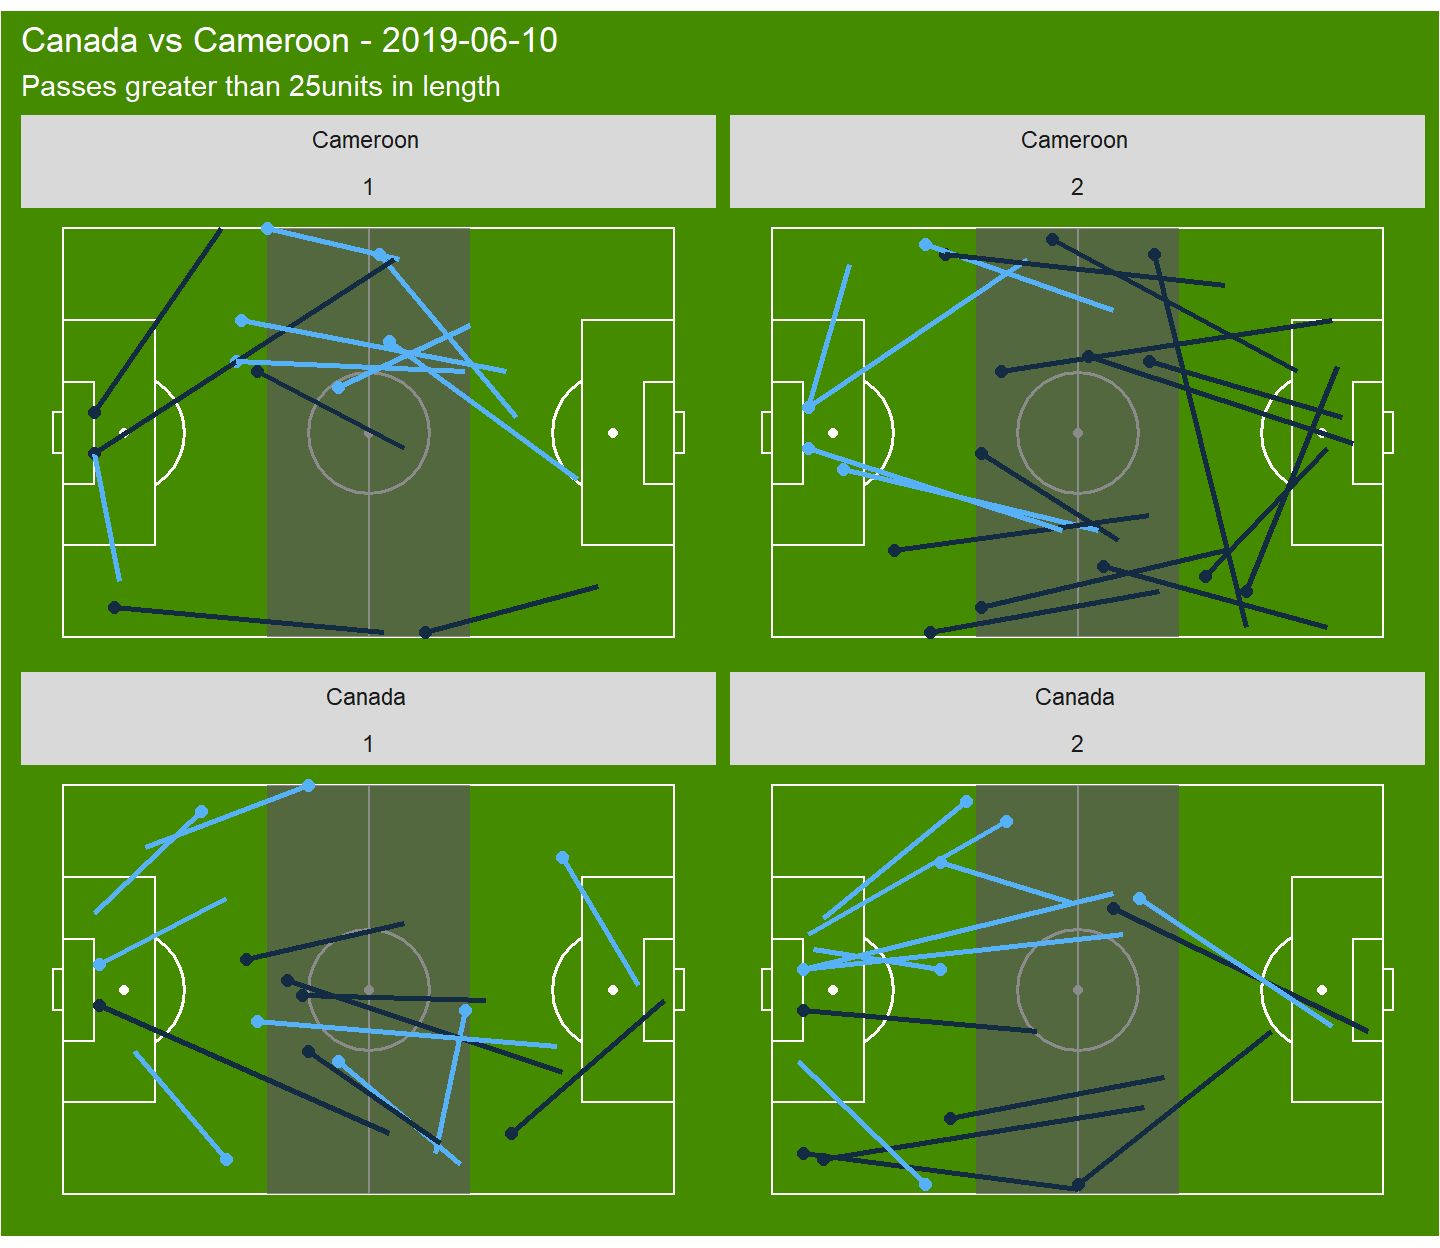
From this plot we can see Canada were more successful completing pass attempts greater than 25 units in length, with the majority of these passes coming from the first third of the pitch. Cameroon however, looked to play these passes from the middle to final third and were often unsuccessful with these attempts. This was often in an attempt to try and to break quickly in a counter, often ending with a Canadian defender retrieving the ball.
Game 3: New Zealand vs The Netherlands
This game was definitely one sided in terms of pass, as seen in Table 3. NZL were on the back foot and were unable to hold the ball well during this match, shown by the lighter blue in the graph below. Despite this they were able to create a few of the best chances of the match during the first half, with a ball hitting the crossbar and an open shot both failing to beat the Netherlands keeper.
| Team | Half | Total Passes | Successful Passes | Pass Percentage |
|---|---|---|---|---|
| Netherlands | 1 | 364 | 300 | 82 |
| Netherlands | 2 | 361 | 300 | 83 |
| New Zealand | 1 | 176 | 111 | 63 |
| New Zealand | 2 | 151 | 83 | 55 |
| a Table 3: Passing summary for New Zealand vs Netherlands by half |
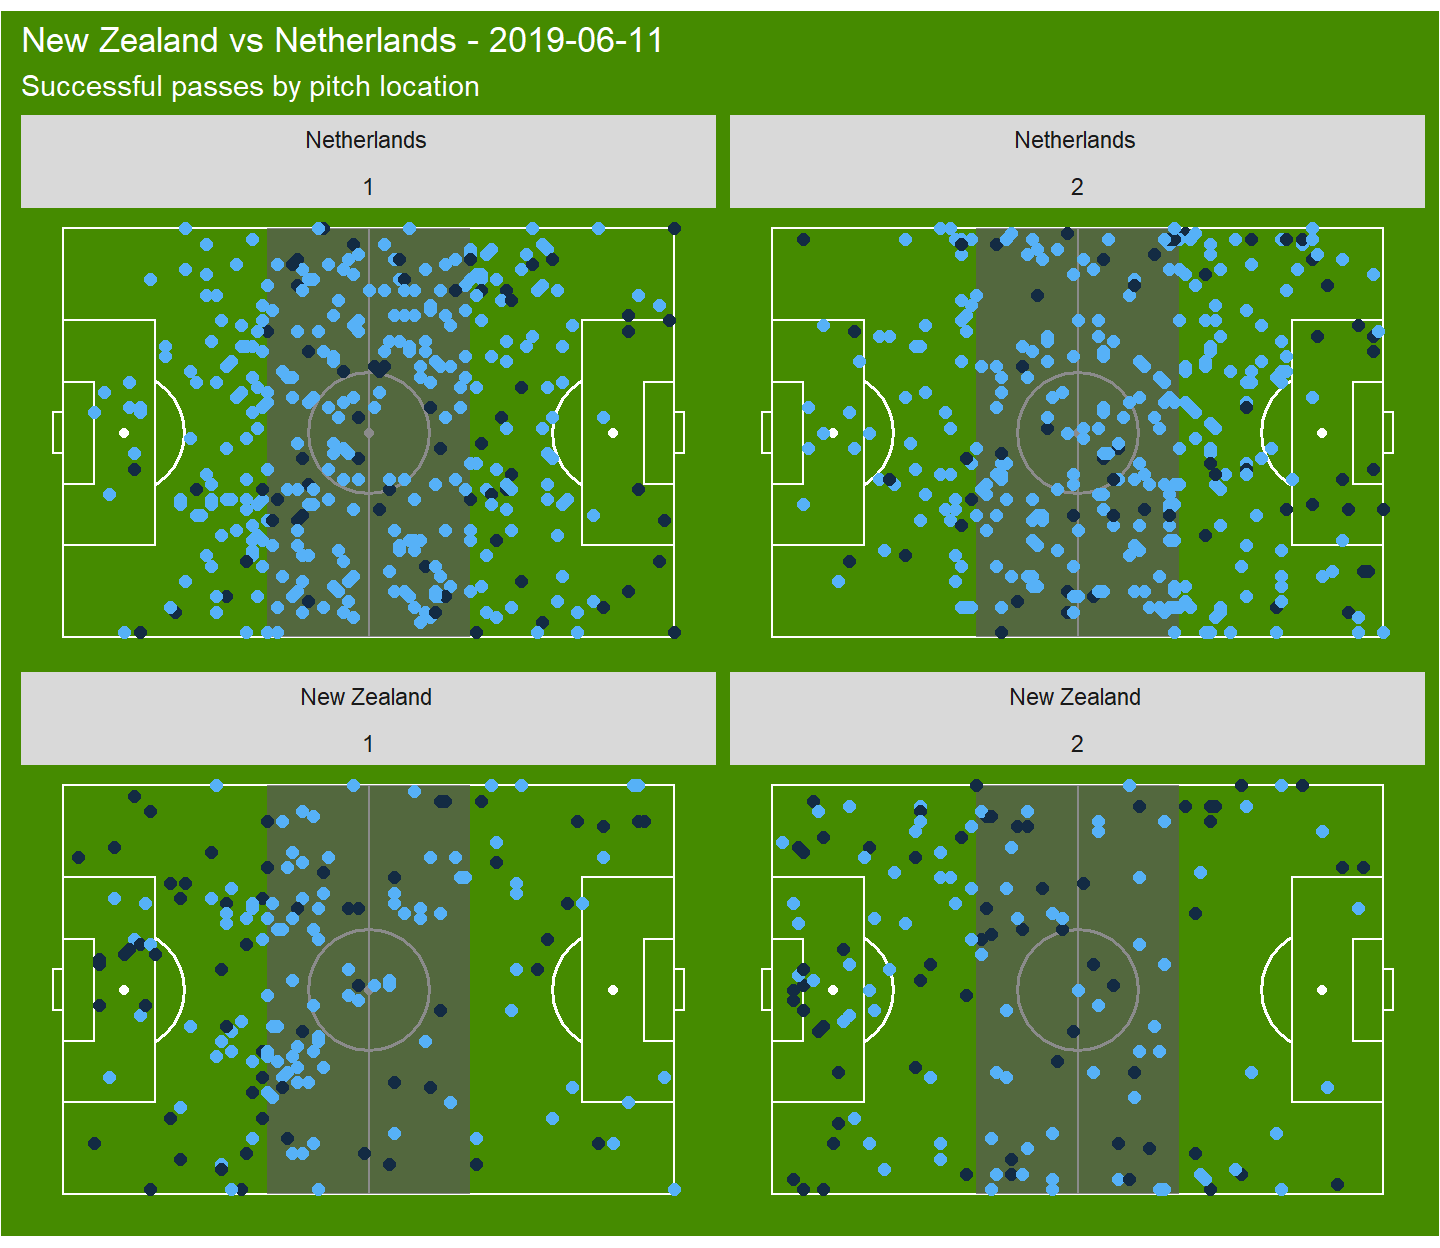
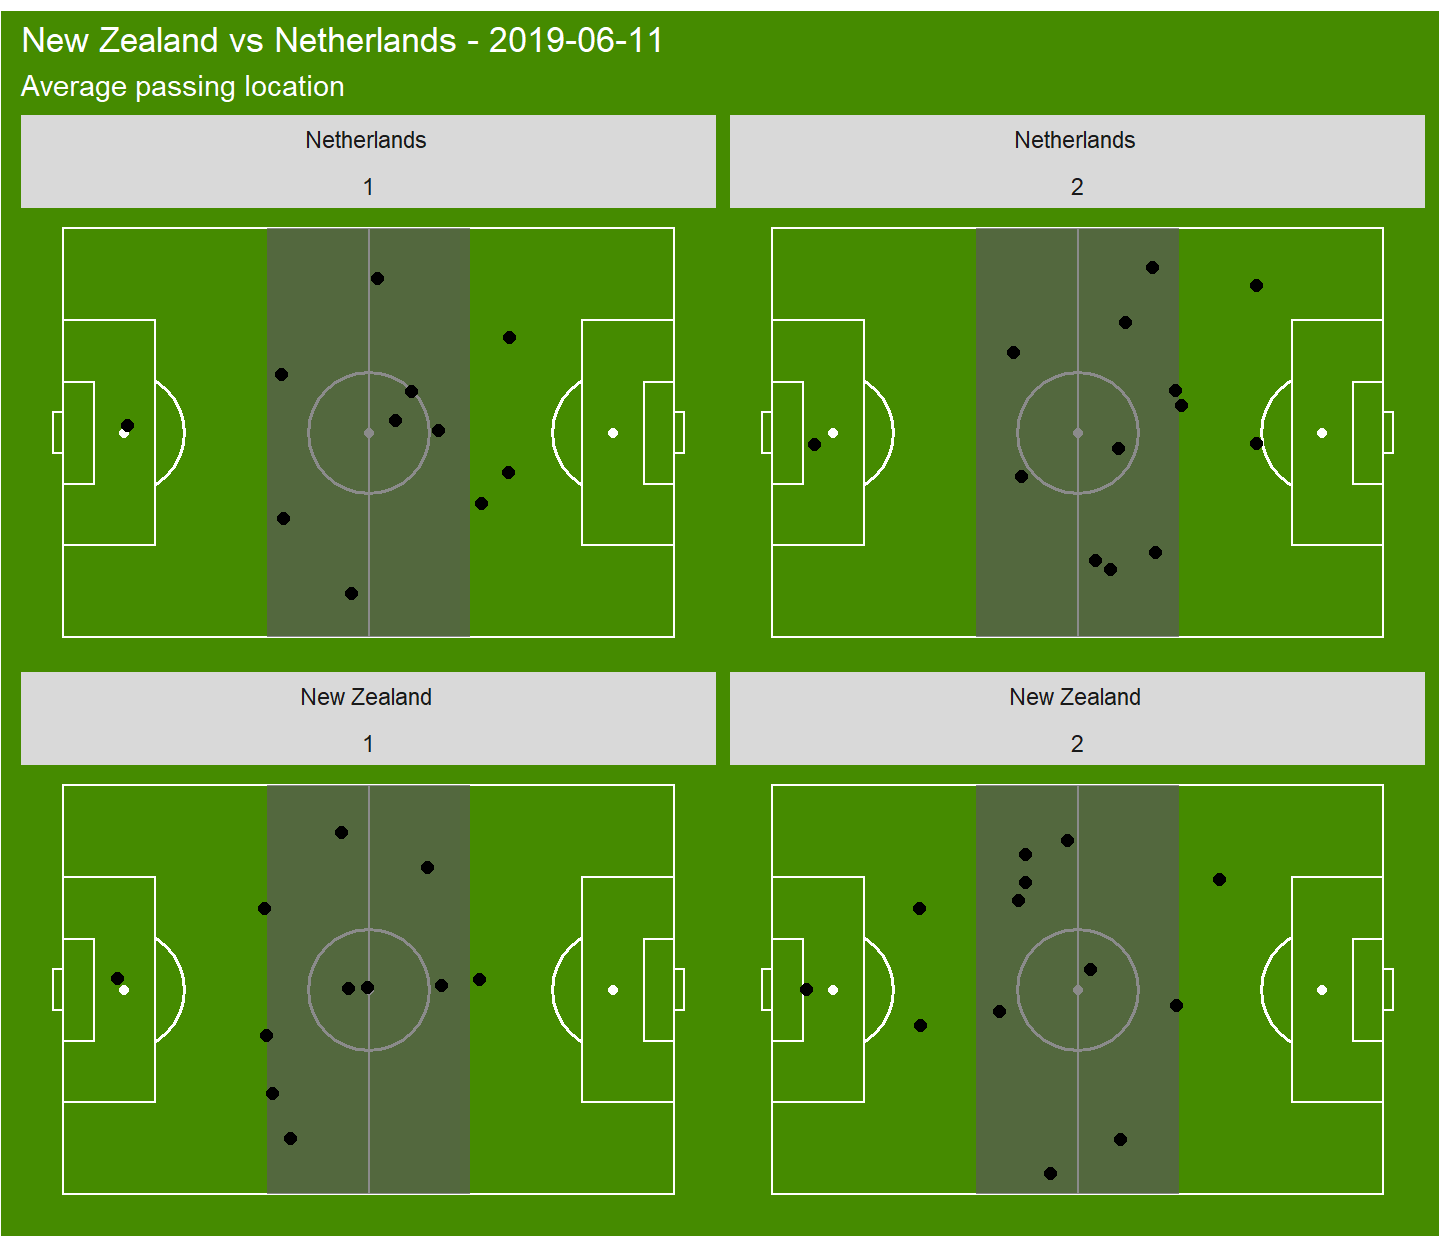
The Netherlands did a better job of maintaining position through each third of the pitch and progressing towards goal scoring opportunities. NZL on the otherhand, appears to have lost position more frequently in their first third, finding it difficult to maintain possession through the thirds. This is more apparent in the second half, where they attempted fewer passes in the final third of the pitch. As the game progressed, NZL were forced to defend more, with their average pass locations begining closer to their goal box, whereas the Netherlands moved higher in to their final third, asserting their dominance and eventually finding a winner late in the match.
This shows you the importance of looking in to the passing ability of a team. There was sight differences in each game, with Scotland becomming more successful in the second half, Cameroon looking to catch Canada on the counter-attack and the Netherlands showing how to maintain possession through each third of the pitch. It would make sense to take this type of analysis further, looking for teams and players who can maintain possession and make key or progressive passes up the pitch leading to chances. I will look to take this post written by @_POTP as inspiration to guide this process.
We don’t have to apply anything too complicated to the data to find these numbers or plot these graphs. But if anyone has any questions please don’t hesitate to contact me on Twitter or through the contact form on my website.
Thanks again to StatsBomb for supplying this data to us for free!