Hi guys,
In this weeks statistical blog, I am going to talk about the z-score. I recently posted about this and had some awesome response. Here is the post if you hadn’t seen it already.
I just wanted to take a moment to add a little more information about the z-score and what you can use it for. Sometimes, the statistical theory is useful when it comes to implementing or using a new value.
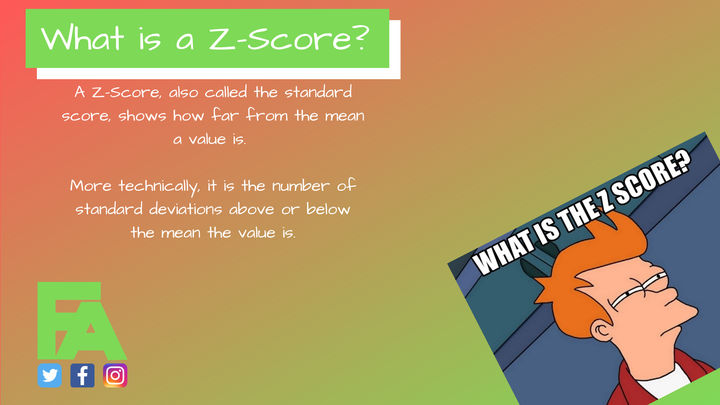
So what is the Z-Score?
The z-score is often also referred to as the standard score, as it standardises the value against previous values. Essentially, the z-score indicates how many standard deviations a value is from the mean of all previous values.
So to calculate the z-score, you need the following things:
- All previous data to calculate.
- The Mean.
- The Standard Deviation.
- The current value.
We can then use the following formula:
\[z\ = \frac{x_i-\mu}{\sigma}\]
This formula states that the z-score equals the current score, minus the mean, divided by standard deviation. So, the difference between the current score and mean, devided by your standard deviation will give you a standardised value.
It is important to note, that the z-score assumes your data is evenly distributed. In the case that your data is skewed, the z-score might not be for you.
What can I use it for?
One use of the z-score could be questionnaire type data, as an example, wellness data. Wellness data tends to be asked on a discrete scale, allowing for data evenly, or near to evenly, distributed around the mean. When used in this scenario, you can easily tell if an athlete is reporting better, or not as well, as normal.
For example, when the athletes value is 0 or more, then they have reported better than historically. Less then 0 and they lower than historical. It would be important for you to gather data in your population to find bands that best fit your team of athletes before trying to apply a warning system of some kind.
If you are looking to apply it to your wellness data, this video might help!
Another example might be testing data, where an athlete has a testing history and you want to see change from historical. In this example, being less than 0 might indicate a positive change in test performance, so it is important to understand the direction of your values and what makes the most sense in what scenario.
If you are looking to start using the z-score, let me know in the comments below how you plan to use it. I would be interested in hearing all the uses it might have!
So that is a little more background on the z-score. I hope you find it useful and start to apply it where appropriate in your context.
Until next time!
Josh