In this tutorial I will explain how to place and plot shots from different positions on the pitch. For example, what if we only want to see the shots taken from outside the box, or those taken within the 18 yard box, but outside the six yard box? We can assign a zonal value to these using the between function from dplyr, a package from the Tidyverse. So some pre-requisites for this tutorial are the following:
### Packages required to run the tutorial that follows.
library(dplyr)
library(ggplot2)
library(ggsoccer)
Once these packages are all loaded, we can read in our data and filter for one teams shots over the entire season of the FA Women’s Super League, in this example we will use Manchester City.
### I have already read in the data previously using the following function and called it
### data so I have commented this out here.
# data - read_csv("StatsBomb_ShotSummary.csv")
data <- data %>%
  filter(team.name == "Manchester City WFC")
Our data will include only games played by Manchester City throughout the FA WSL, of which we have 389 shots taken. This should be a good number to analyse providing us a good example of how to place this data in to positional zones. So let’s start with using the box as a first example. Using the StataBomb event data specifications, they provide use with the pitch co-ordinates they use.
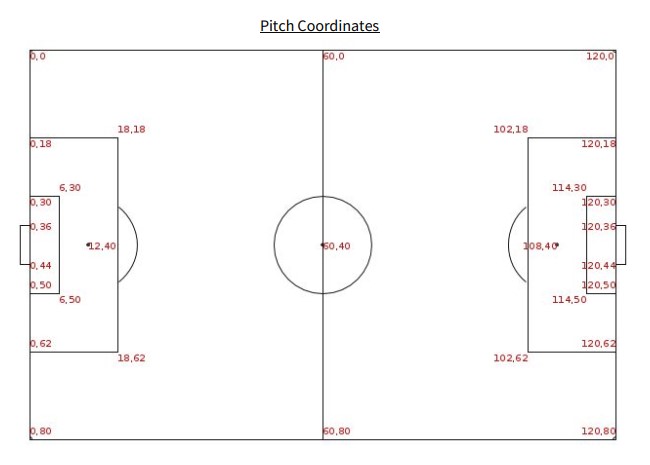
So let’s create a binary column (1 or 0) in relation to the shot being taken either in or outside the box.
### First let's link to the data we read in earlier
### then using the piping operator (%>%) we can
### add a new column using mutate()
BoxData <- data %>%
mutate(in_box = if_else(between(x, 102, 120) & between(y, 18, 62), 1, 0))| in_box | Shots | Goals |
|---|---|---|
| In Box | 245 | 39 |
| Out of Box | 409 | 51 |
| a Table 1: Summary of shots in and outside of the box |
So we can see that Manchester City scored 41 goals in the box and 10 from outside the box. So now let’s plot to double check our data is accurate and out positions are correct.
BoxPlot <- BoxData %>%
  mutate(Goal = as.factor(Goal)) %>%
  ggplot(aes(x=x, y=80-y)) +
  annotate_pitch(dimensions = pitch_statsbomb, colour = "white", fill   = "chartreuse4") +
  geom_point(aes(colour=Goal),size = 2) +
  coord_flip(xlim = c(59, 121),
             ylim = c(-1, 81)) +
  facet_wrap(~in_box) +
  theme_pitch() +
  theme(plot.background = element_rect(fill = "chartreuse4"),
        title = element_text(colour = "white")) +
  theme(legend.position = "none") +
  ggtitle("Manchester City Shots",
          "Shots taken in or out of the box and if they were scored (blue) or not (pink)")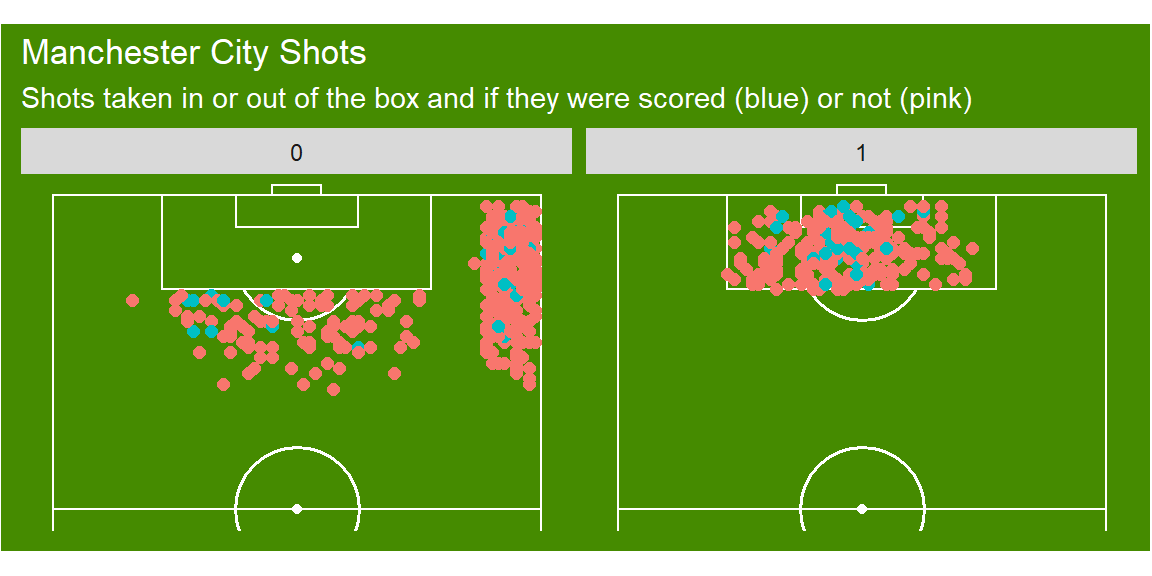
We can also plot our data in to different pitch zones based. Let’s do this now using the following code.
ZoneData <- BoxData %>%
  mutate(in_zone = if_else(between(x, 102, 120) & between(y, 30,50), 1,
         if_else(between(x, 102, 120) & between(y, 18, 30) | between(x, 102, 120) & between(y, 50,62), 2, 3)))
Let’s now view the summary of all the shots Manchester City had in each of these zones.
| in_zone | Shots | Goals |
|---|---|---|
| Zone 1 | 182 | 35 |
| Zone 2 | 63 | 4 |
| Zone 3 | 409 | 51 |
| a Table 1: Summary of shots in each of our three zones |
And we can also see the plot to see that these shots were zoned properly.
ZonePlot <- ZoneData %>%
  mutate(Goal = as.factor(Goal)) %>%
  ggplot(aes(x=x, y=80-y)) +
  annotate_pitch(dimensions = pitch_statsbomb, colour = "white", fill   = "chartreuse4") +
  geom_point(aes(colour=Goal),size = 2) +
  coord_flip(xlim = c(59, 121),
             ylim = c(-1, 81)) +
  facet_wrap(~in_zone) +
  theme_pitch() +
  theme(plot.background = element_rect(fill = "chartreuse4"),
        title = element_text(colour = "white")) +
  theme(legend.position = "none") +
  ggtitle("Manchester City Shots",
          "Shots taken in each of our zones and if they were scored (blue) or not (pink)")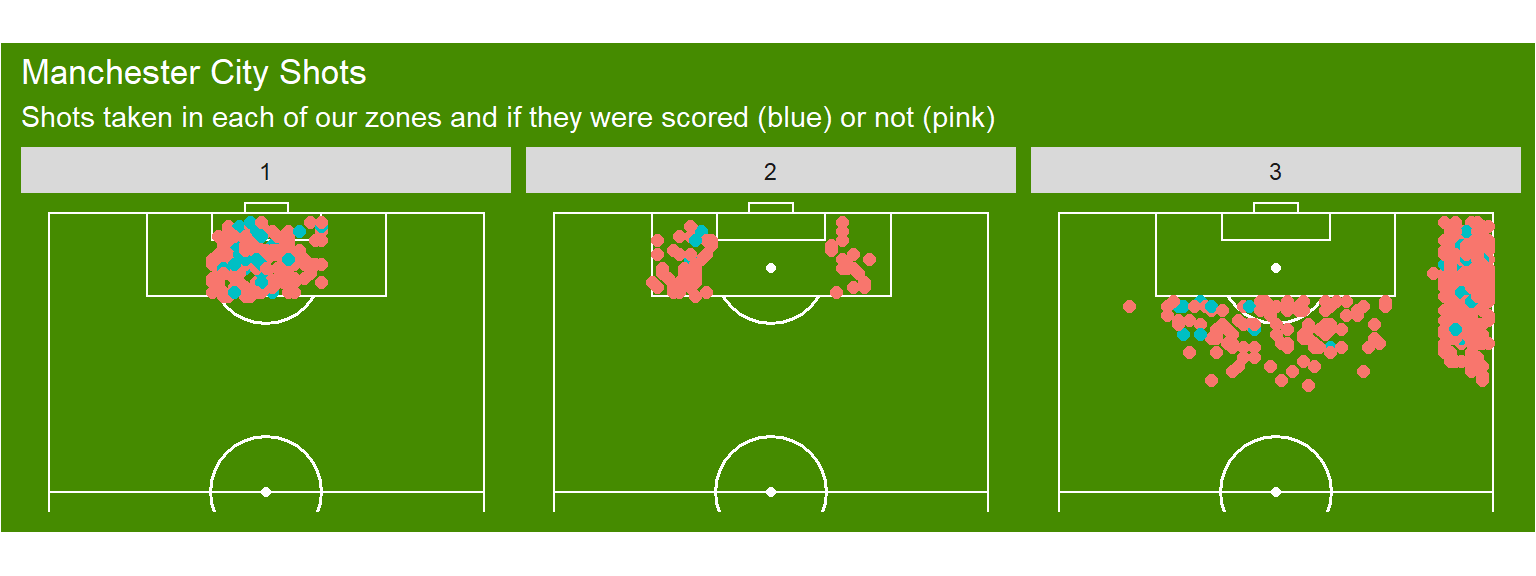
So there we have it, we can place all of our shots in to different positions on the pitch. We can use this information to calculate probabilities of scoring from different pitch positions are just to see how many goals we score from different positions on the pitch.
I hope this is helpful and if you have any questions feel free to reach out to me.
Thanks!