What is Power Bi?
Today I would like to introduce something new on to my blog, Power Bi. Some of you might have heard of this software, but for those who haven’t, Power Bi was developed by Microsoft to provide Business Inteligence software to compete with Tableau and others on the market. Power Bi uses a drag and drop based interface providing an easy to pick up interface for users. This is what the interface looks like for users:
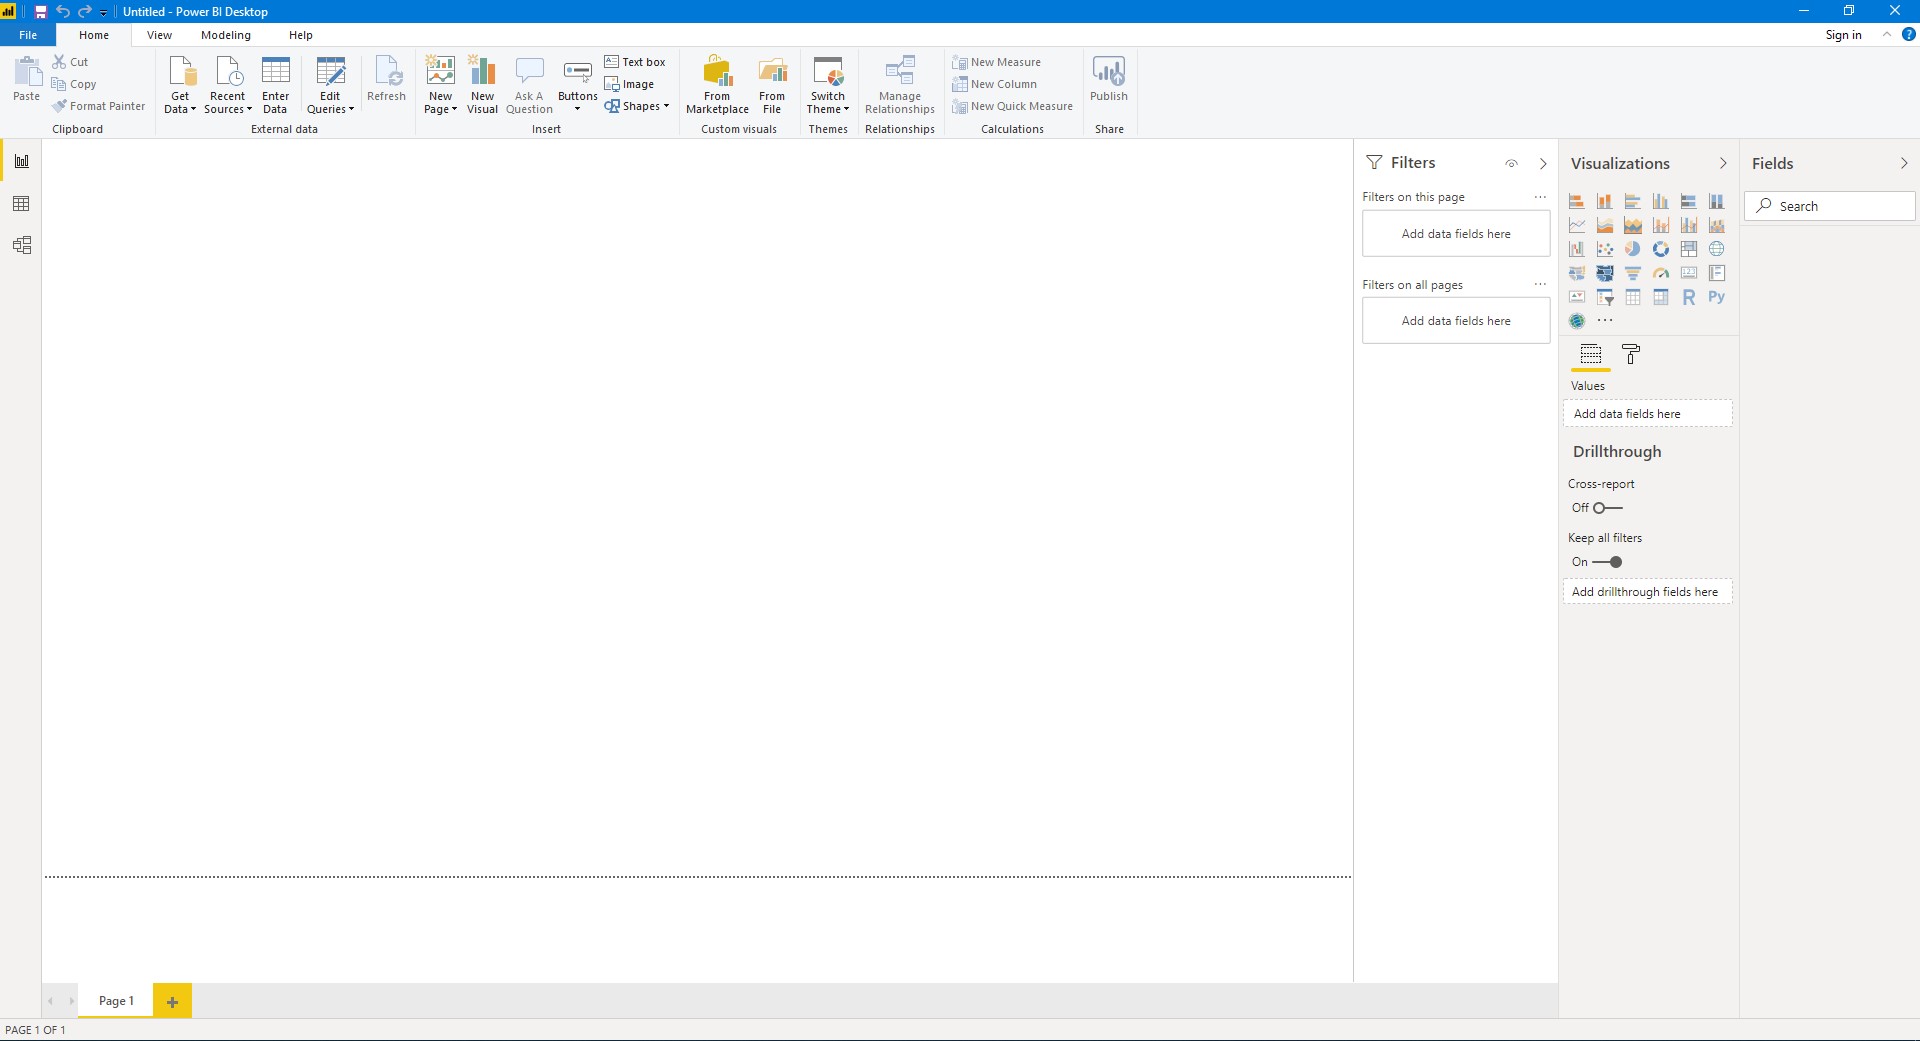
Power Bi can read in data from a number of different sources, including Excel files, CSV files, online web sources and SQL databases to name a few. Once data is read in, you can adjust the query to include or exclude what ever you like. You can append or merge queries in to one data source, you can create new conditional columns or calculate new data fields as you require. The options are continuing to grow as the software is developed over time.
To visualise data, an easy to use interface is present with a drag and drop style. We no longer need complicated Excel formula to calculate averages and standard deviations for our graphs, as these are all built in functions present within Power Bi. Once you choose the visulisation you want to create from the visualisations pane, you can add the data fields you would like and the choose the aggregation. For example, here is a quick snapshot of the top 20 goal scorers in the FA WSL.
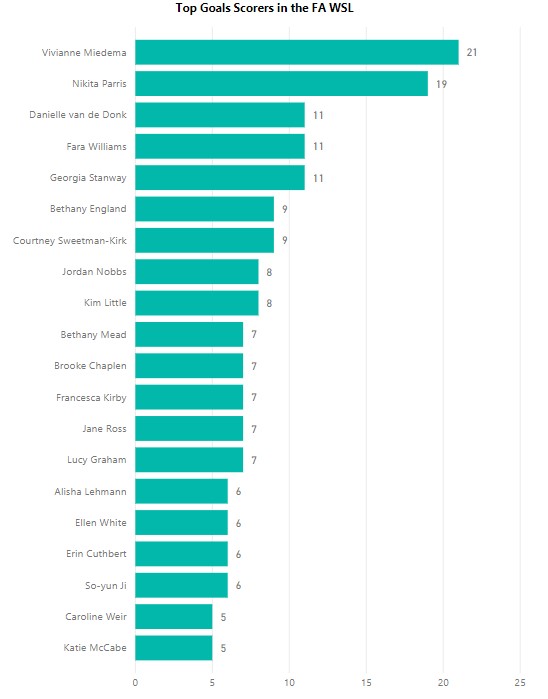
However, the only current limitation to Power Bi is the customisation options for the visualisations. For example, data labels can’t be customised to show a value other than that of what the visualisation is presenting. For example, if you have a stacked graph, a label will appear for each portion of the graph but you are not able to change one value to show the total value of the stacked graph. The updates provided for Power Bi are monthly however, with a number of new features added frequently. The power of this software will only continue to grow as time goes on.
Here is a small video of me creating the above graph:
How useful is Power Bi?
Currently, Power Bi is still an incredibly useful tool in the world of business intelligence software. With the backing of Microsoft, in time Power Bi will likely become the world leader in this sector. With frequent updates and new features, Power Bi has improved significantly since it’s initial release and will only continue to get better and better. I have used Bi for the last two years and since then, it’s abilities have improved significantly. I am now able to do things I could only dream of in the beginning.
Aims for this project
I hoping to help provide a useful avenue for people beginning to use Power Bi, or even the more advanced user, to learn and grow with the software. I wouldn’t call myself an advanced user but I feel I am able to provide useful tutorials to those wishing to learn. So my aims would be the following:
1. To provide useful tutorials to the community.
2. Provide feedback and assistance to those who follow this blog.
3. Create a repository of help documents and files that may assist those starting out.
If anyone has questions or requests for things they would like to see, please don’t hesitate to reach out. I am always learning and finding new ways of making things in Bi, so the more challenging the better!
For more on Power Bi, you can read here.