Hi Everyone,
I recently had a few people reach out to me about creating plots in Power Bi for visualising the direction of kicks in Rugby. Sure it is a different sport, but I thought this was a perfect time to show a few methods of doing this, using football data, that we can apply back to rugby data. First of all, I’ll walk through a couple of options using base Power Bi visuals that you have available. Then, I will move on to the power of R in Power Bi and how to create visuals that show both location and direction of a kick. So let’s start with Powerbi!
\[\\[0.1in]\]
Power Bi
The first option with base Power Bi is using a simple scatter plot to visualise the location of a kick. This method is perfect as an initial starting point, probably providing the best option for performance as it is a built-in visual. But there are a few limitations:
- You can only show the x/y coordinate location of the kick.
- You are unable to visualise the direction as a line segment.
- Locations may not be accurate on top of an image of a field.
This doesn’t mean you can’t create this kind of plot, you just need to keep in mind that it might not be perfect. Firstly, the location of the plot is easily visualised using the scatter plot. You can adjust the axes to match the data provider you are using. However, you can’t add the line segment that shows the direction or length of the kick. Further, the pitch can be added as a background image to the plot which may not match the coordinates of your data provider.
The video below shows you how to create this visual in Power Bi!
\[\\[0.1in]\]
\[\\[0.1in]\]
R in Power Bi
Now that we have identified some limitations using a scatter plot in Power Bi, let’s find some solutions using an R visual. The R visual allows you to add data and supply code to create a plot. You might be thinking, does this mean I need to know how to use R? The answer is not really, but if you can find code that works using Google Search, then you will be okay!
First, there are a couple of things you will need before you create the visual. You will need R installed on your computer so Power Bi can create the visual. You will also need the packages installed that you want to use, so for this example, that means ggplot.
The benefit of using an R visual is that you can visualise the location, direction and length of a kick or pass on top of an accurate pitch background. For those using football data, this means you will also want the ggsoccer package installed (ggrugby for those in rugby). These packages provide the ability to extend the functions of ggplot, to add a football or rugby pitch to your visual.
If we were creating this visual in R, the below code will do that for you, creating the plot you see below.
plot <- data %>%
  ## filter to only successful passes
  filter(is.na(pass.outcome.name)) %>%
  ggplot() +
  ## add pitch to the plot with colour
  annotate_pitch(dimensions = pitch_statsbomb,
                 colour = "white",
                 fill   = "springgreen4",
                 limits = FALSE) +
  ## plot the passes on the pitch
  geom_point(aes(x=location.x, y=location.y), colour="coral") +
  ## add the line segments
  geom_segment(aes(x=location.x, xend=pass.end.x, y=location.y, yend=pass.end.y),
               colour="coral",
               arrow = arrow(length = unit(0.1, "cm"),
                             type = "closed")) +
  ## remove all axes and lines
  theme_pitch() +
  ## add directional label to bottom of plot
  direction_label(x_label = 60)

plot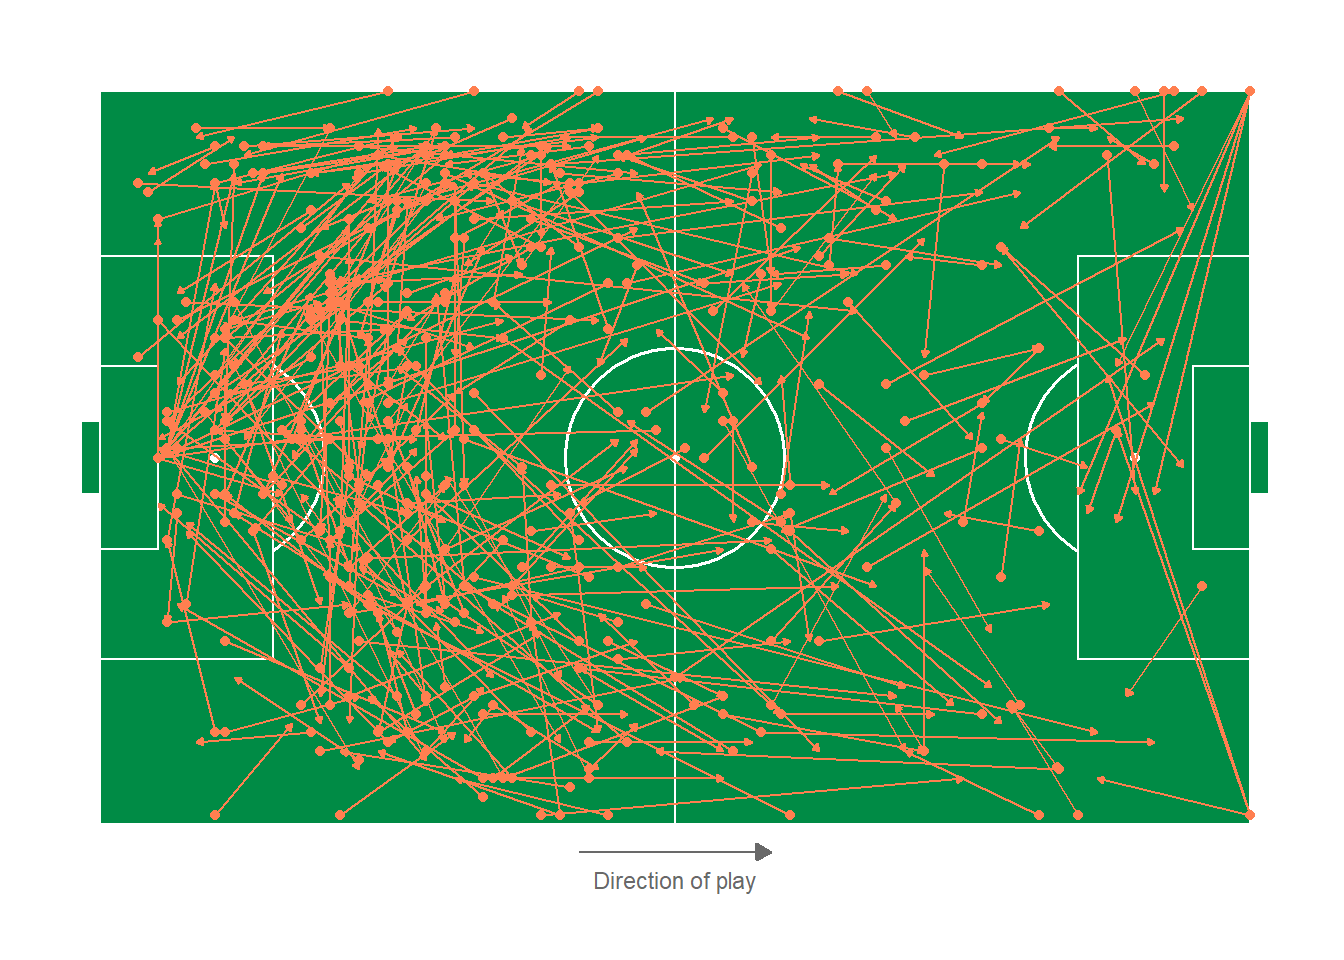
To translate this to Power Bi, follow the video below to see how it is done! In this video, I show you how to create a shot map with an R Visual, which can be easily adapted to passes or kicks.
\[\\[0.1in]\]
\[\\[0.1in]\]
If you enjoyed this post, let me know below in the comments. Also, let me know if you are trying to create a pass or kick map in Power Bi. Would be really interested how others are creating their pass or kick maps!
If you need help adjusting the code for the shot map, feel free to reach out, I will be more than happy to assist.
Until next time,
Josh