The analysis of passing in elite soccer is common place. Often media shows simple pass counts and pass completion rates but there are much better ways of viewing this type of data. For example, we can create a passing network based on the average position of players when making a pass. We can also show where the number of passes they make between themselves and another player. This could be extremely powerful data to show how the passes between players and from where on the pitch. So let’s take a look at a couple of passing networks below based on data from the FA Women’s Super League.
An example of the code to create a passing network can be found below. This code may have a better method, but this is something that I found to work quite effectively. Any comments would be appreciated.
data2 <- data1 %>%
  filter(match_id == 19770) %>%
  filter(team.id == 746)

  # full game passing stats for labels
  passes1 <- data2 %>%
    filter(type.name == "Pass") %>%
    group_by(pass.outcome.name) %>%
    tally() %>%
    filter(!pass.outcome.name %in% c("Injury Clearance", "Unknown")) %>%
    mutate(pass.outcome.name = fct_explicit_na(pass.outcome.name, "Complete"))
  pass_n1 <- sum(passes1$n)
  pass_pc1 <- passes1[passes1$pass.outcome.name == "Complete",]$n / pass_n1 * 100


  # filter events before time of first substitution, if at least one substitution
  min_events1 <- data2 %>%
    group_by(player.id) %>%
    dplyr::summarise(period = min(period), timestamp = min(timestamp)) %>%
    na.omit() %>%
    arrange(period, timestamp)

  if(nrow(min_events1) > 11) {
    max_event1 <- min_events1[12,]
    idx1 <- which(data2$period == max_event1$period & data2$timestamp == max_event1$timestamp) - 1
    data2 <- data2[1:idx1,]
  }

  # get nodes and edges for plotting
  # node position and size based on touches
  nodes1 <- data2 %>%
    filter(type.name %in% c("Pass", "Ball Receipt*", "Ball Recovery", "Shot", "Dispossessed", "Interception", "Clearance", "Dribble", "Shot", "Goal Keeper", "Miscontrol", "Error")) %>%
    group_by(player.id, player.name) %>%
    dplyr::summarise(x = mean(x, na.rm=T), y = mean(y, na.rm=T), events = n()) %>%
    na.omit() %>%
    as.data.frame()

  # edges based only on completed passes
  edgelist1 <- data2 %>%
    mutate(pass.outcome.name = fct_explicit_na(pass.outcome.name, "Complete")) %>%
    filter(type.name == "Pass" & pass.outcome.name == "Complete") %>%
    select(from = player.name, to = pass.recipient.name) %>%
    group_by(from, to) %>%
    dplyr::summarise(n = n()) %>%
    na.omit()

  edges1 <- left_join(edgelist1,
            nodes1 %>% select(player.id, player.name, x, y),
            by = c("from" = "player.name"))

  edges1 <- left_join(edges1,
            nodes1 %>% select(player.id, player.name, xend = x, yend = y),
            by = c("to" = "player.name"))

  edges1 <- edges1 %>%
    group_by(player1 = pmin(from, to), player2 = pmax(from, to)) %>%
    dplyr::summarise(n = sum(n), x = x[1], y = y[1], xend = xend[1], yend = yend[1]) %>%
    na.omit()


  # filter minimum number of passes and rescale line width
  nodes1 <- nodes1 %>%
    mutate(events = rescale(events, c(2, 30), c(1, 200)))

  # rescale node size
  edges1 <- edges1 %>%
    filter(n >= 3) %>%
    mutate(n = rescale(n, c(1, 30), c(3, 75)))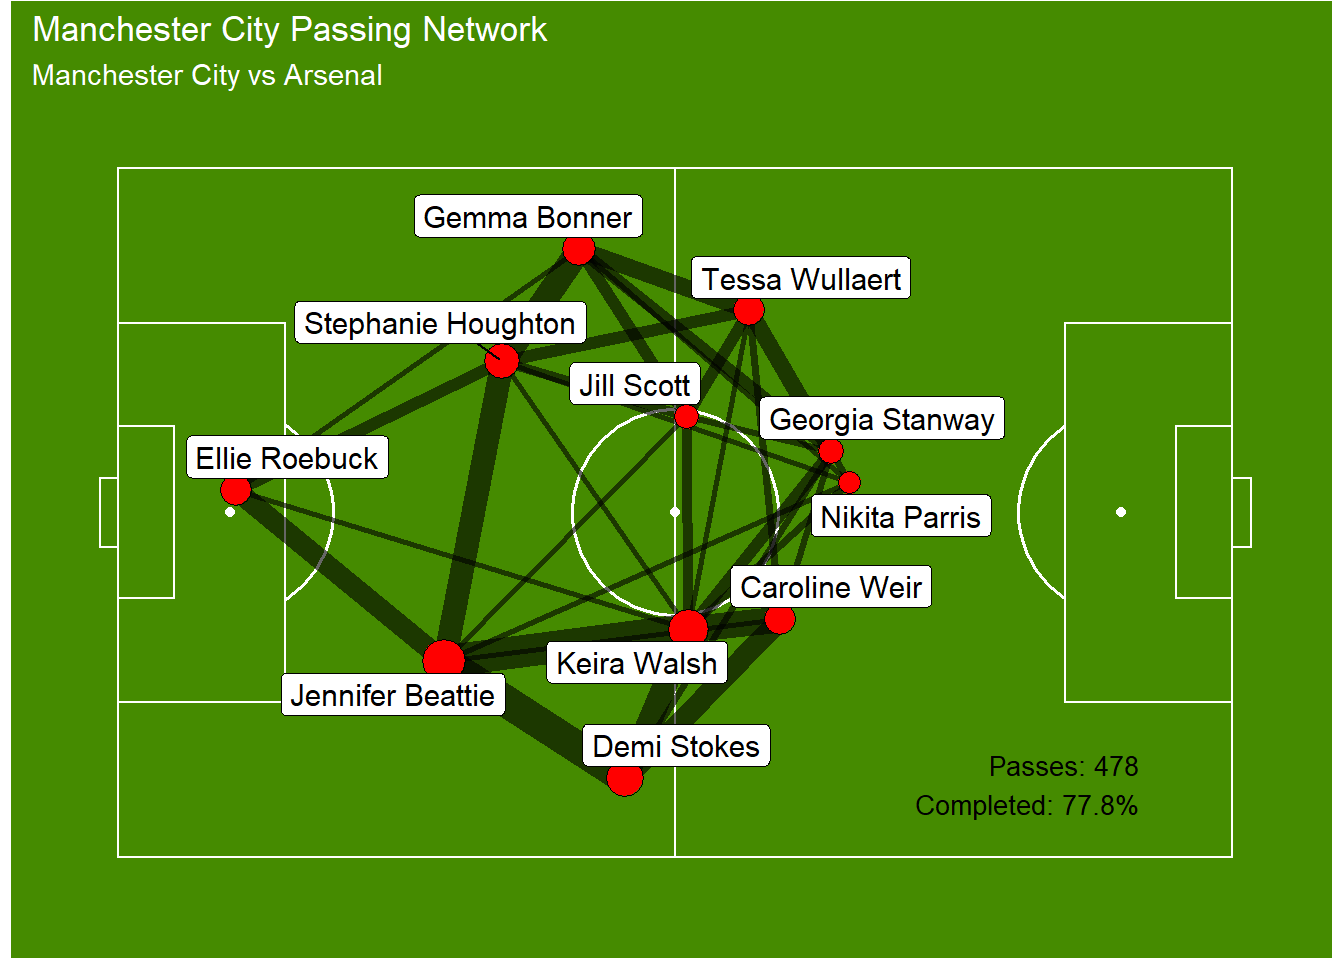
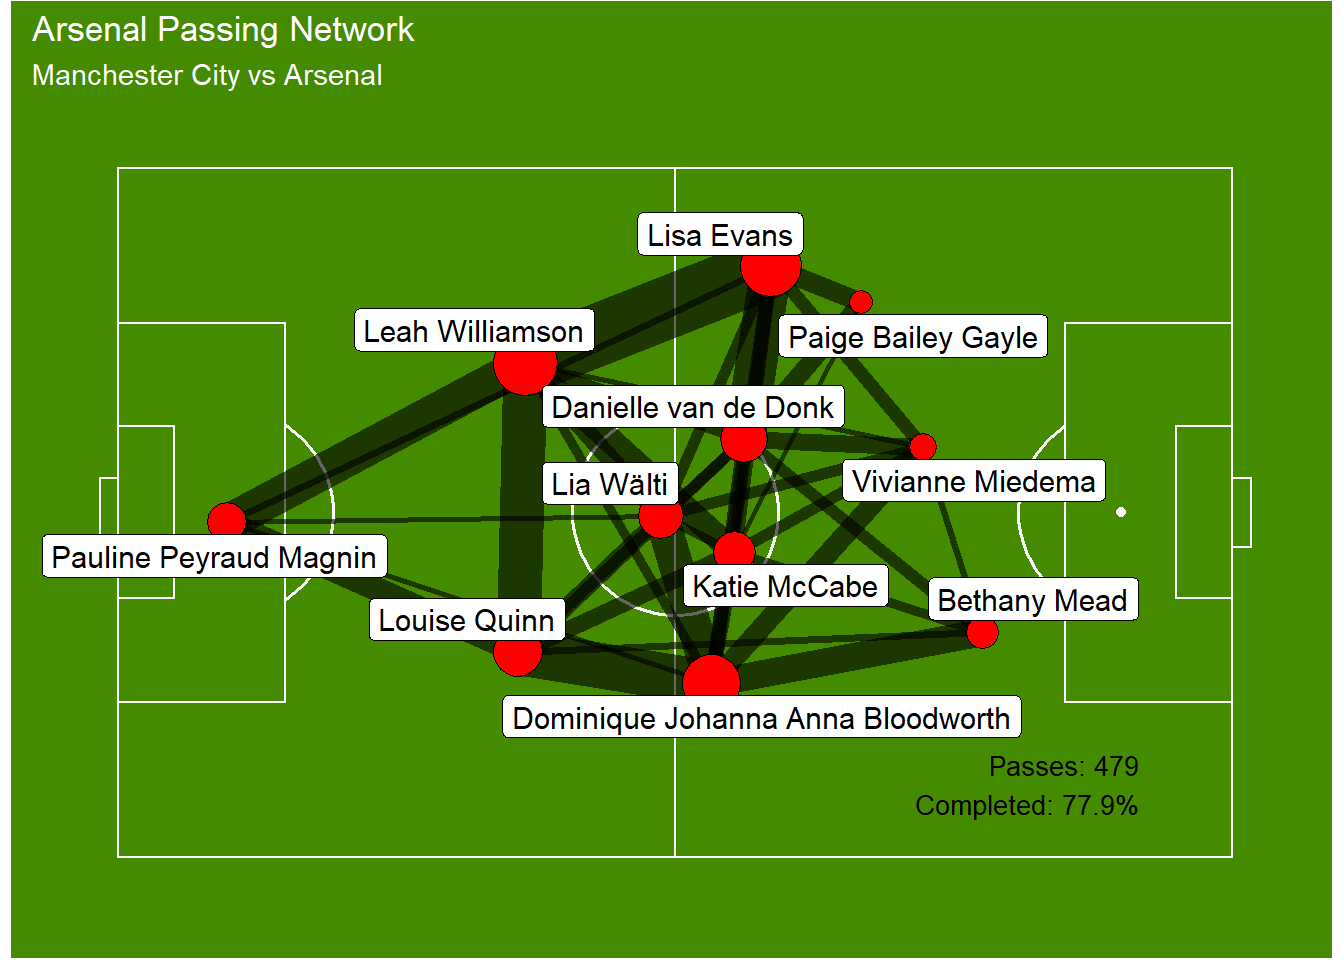
From this, we can see two different plots. Arsenal kept their centre backs quite close together, with their full backs getting high up the pitch, possibly to aid in attack, whilst their midfield three stayed quite compact.
Manchester City on the other hand had their centre backs spread apart and their full backs close. Their midfield appears to have had two holding players with possibly one higher up to offer more in attack in this game.
As we can see, this can offer a lot of insights to how a team might play, but this is only the start. We can expand these further to provide even greater insights in to the data we are viewing. That is something I will expand on in future posts.