Are you new to Power Bi, or have you been using it for a while? Do you know what the Data Model is or how it can help your reporting? This week, we are talking about some best practices to understand and optimise your data model.
One of the things that differentiate Power Bi from previous user experiences in Excel is the data model. The data model drives the way your visuals and interactions work on your report pages. It can make your life easy or incredibly complicated, so it is something you want to get right. In this post, we will start with how to structure your data before looking at other aspects of the data model.
\[\\[0.1in]\]
1. Data Structure, why is this important?
The data structure is the beginning of your data model. If you have a single table, that is extra wide, you are likely not using all of the columns. As your data set grows, this can cause performance issues, increasing data scan times which can slow down visual times, making your report look laggy.
Tip 1 - Reduce the number of columns in your data sets to only those you need. This makes it easier to work with whilst also helping to improve performance when your data set grows.
The number of columns is one issue, but also the way your data is set up can also cause probelms. Some visuals require a gathered view, whilst others will want a single row per observation. If you need require a gathered view, with a single row per metric and value, you can perform this transformation using PowerQuery which will save you a number of headaches when trying to create your visuals or measures.
Tip 2 - Perform data transformation in PowerQuery or even outside Power Bi to improve data load times and reduce the complexity of measures.
\[\\[0.1in]\]
2. Facts and Dims, what are they?
Further to your data structure is the creation of facts and dims. Now you’re probably thinking, what is this guy talking about? Facts and dims come from data warehousing terminology but are probably the best way of describing what is required to optimise your data model.
A fact represents the measurements or metrics of a process. In sport, this would be things like training load, match performances or testing measures. This would provide the values to your visuals, such as the number of goals scored or distance run.
A dim is used to categorise the facts. Often these would-be athletes, dates or match information. When you add this information to your visuals, the data gets categorised by the athlete or match included.
Now you’re thinking, what’s the best method of relating the fact and dim tables? Unique values are your best method, and in my opinion these should be values that are numeric, or auto generated, so that you don’t require user input. Where user input is required, such as writing out athlete names, you can get mistakes and so data will not always match the way you would like.
Tip 3 - Use numeric unique identifiers to relate your fact and dim tables to each other, such as an athlete id number (e.g. 1234, 1359 etc). Numeric values are easier for Power Bi to filter and sort compared to alpha-numeric values also, improving performance.
\[\\[0.1in]\]
3. Star Schema, what is it?
Linked to your data structure is the schema of your model. Power Bi works best with a Star Schema, which describes how your facts and dims are related to one another. In this example, one fact is related to multiple dim, but there is never more than one layer. So, as an example, a player dim is related to a training load fact table but does not have anything related to itself. Below is an example of a star schema taken directly from the Microsoft Documentation.
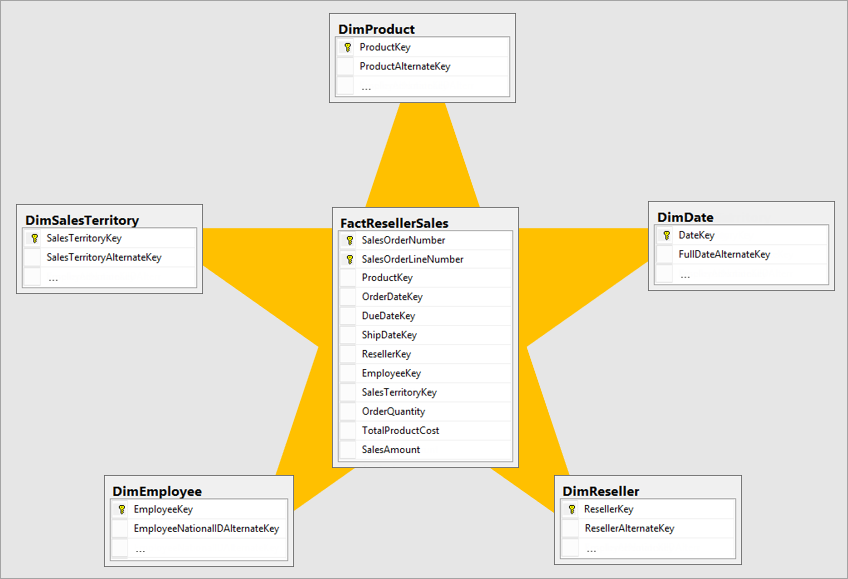
As you can see, there is only one layer of relationships with a single fact. This makes the model incredibly powerful and report creation super simple!
Tip 4 - Use a star schema where ever possible, making sure to link your unique identifiers to create active relationships.
\[\\[0.1in]\]
4. Wait, there’s more?
What if you are unable to join two tables together because they have nothing in common?
In these scenarios, you can create calculated columns with DAX or in PowerQuery that can be used in your relationships. So for example, you have an athlete table that uses initial and then the last name. But your data table has a full name. In your data table, you could create a calculated column that keeps only the initial and last name so you can successfully create a relationship between the two tables.
Tip 5 - Create any extra relationship columns in PowerQuery where possible. This will not only improve data load times, but help to remove the burden of DAX formula that might require maintenance from time to time.
\[\\[0.1in]\]
Video
You can find the full video, walking through the data model and discussing some of these topics below.
As always, hit like on the video and subscribe here for more videos to help you Power Performance Through Data.
Until next time,
Josh