In this post, I decided to take a look back at the FA Women’s Super Leagure season of 2018-19 to examine the attacking and defensive effectiveness of the teams involved. A nice way of doing this is using scatter plots comparing related data to eachother. For example, the following table shows the shots per match and shots per goal summary for the teams in the FA WSL last season.
| Team | Matches | Shots | Goals | Shots Per Match | Shots Per Goal | xG | Home Color Code | Away Color Code |
|---|---|---|---|---|---|---|---|---|
| Arsenal | 20 | 373 | 68 | 18.6 | 5.5 | 49.4 | #EF0107 | #d8b126 |
| Birmingham City | 19 | 254 | 25 | 13.4 | 10.2 | 23.2 | #103bce | #33333d |
| Brighton & Hove Albion | 19 | 207 | 16 | 10.9 | 12.9 | 19.9 | #0057B8 | #2c2c2c |
| Bristol City | 20 | 153 | 15 | 7.7 | 10.2 | 11.8 | #ec2128 | #1e2327 |
| Chelsea FCW | 19 | 392 | 38 | 20.6 | 10.3 | 39.9 | #034694 | #1a1d26 |
| Everton | 19 | 230 | 14 | 12.1 | 16.4 | 20.2 | #003399 | #ff584e |
| Liverpool | 19 | 177 | 17 | 9.3 | 10.4 | 18.2 | #C8102E | #7ff7ef |
| Manchester City | 20 | 389 | 51 | 19.4 | 7.6 | 44.7 | #6CABDD | #e1f1aa |
| Reading | 20 | 295 | 31 | 14.8 | 9.5 | 27.8 | #004494 | #b5253e |
| West Ham United | 20 | 217 | 25 | 10.8 | 8.7 | 22.4 | #7A263A | #9fc1f3 |
| Yeovil Town | 19 | 129 | 10 | 6.8 | 12.9 | 11.1 | #4dac26 | #9d0117 |
| a Table 1: A summary of shots and goals from the 2018-19 FA WSL |
For this table, we used a summarise function, together with group_by of our team names, to sum the shots and goals of each team. We can then count the number of matches they played to provide us with a shots and goals per match value. We can then use this to plot the performance of our teams. A table is a nice way to look at the raw data, but To see who was the best performer out of these teams, it might be easier to view them on a scatter plot. So let’s do that now:

This image gives us a good view of the teams that were able to convert their chances last season. Arsenal managed best shots per goal conversion, managing 5.5 shots per goal and 18.6 shots per match. Manchester City and Chelsea, who ended up 2nd and 3rd respectively, were also in the top 3 performing teams in this scatter, both hovering around 20 shots per match and 10 shots per goal. This is an impressive output which showed how dominant these 3 teams were throughout the season.
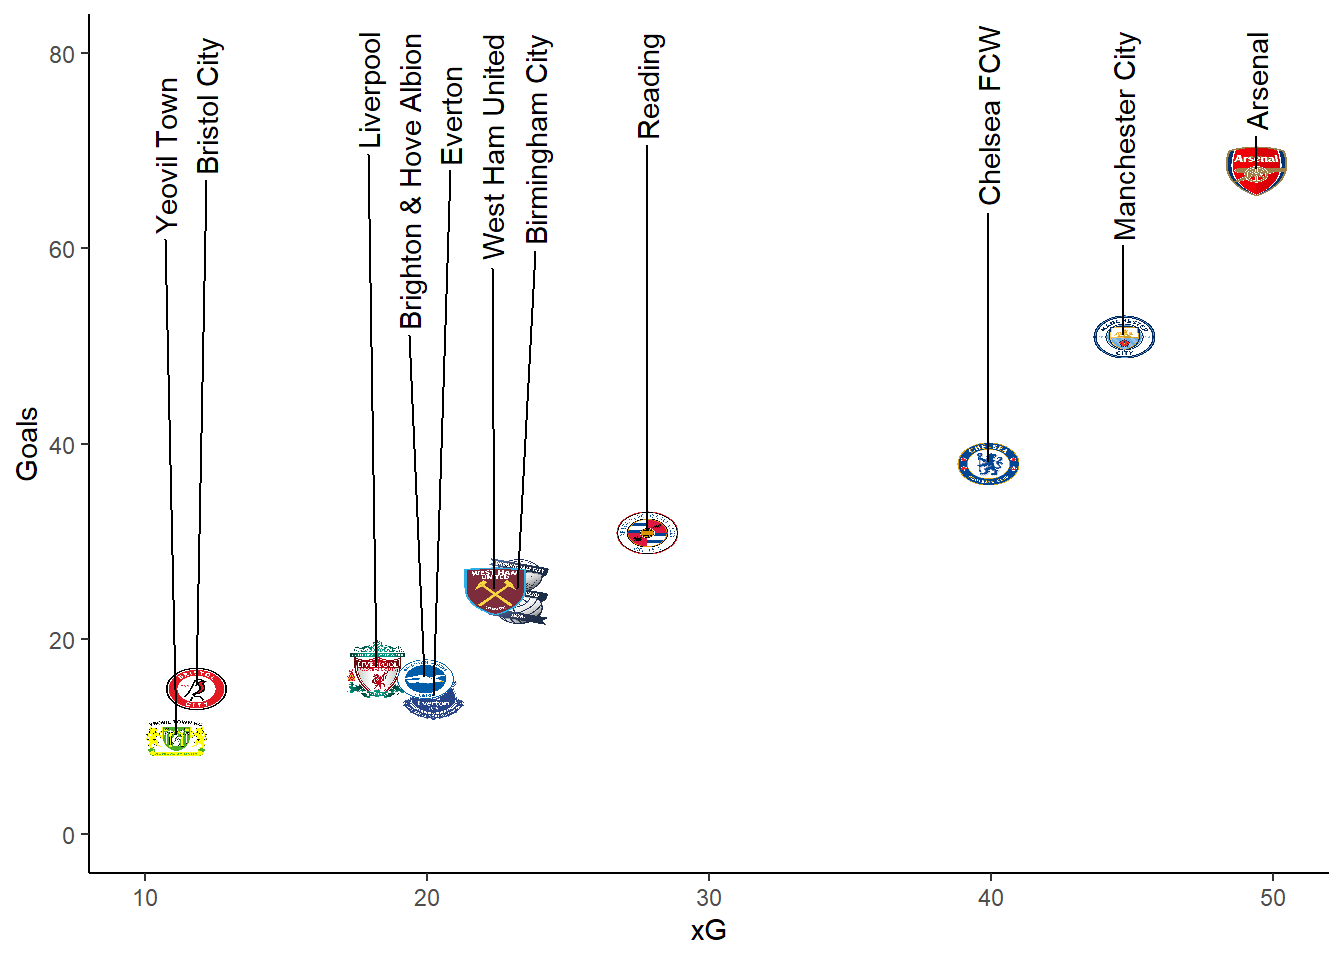
When it comes to xG and Goals we again see the top 3 teams from the table coming out towards the top. Arsenal outperformed their xG quite considerably throughout the season, with 68 goals scored compared to an xG of 44.5, they were on top by 17 goals. Manchester City and Chelsea followed closely behind, but the rest of the league were well behind the top 3 in these metrics.
But defensively, how did these teams perform in terms of shots and goals against them.
To look at goals and shots against an opposition, we need to create a team against column in our dataset. For this we can mutate a column using ‘if_else’ to examine if the team name is the same as the home team, if so put the away team name in the column. We can then use this column to summarise our data using ‘group_by’. Let’s take a look at what this provided us:
| Team | Matches | Shots Against | Goals Against | Shots Per Match Against | Shots Per Goal Against | xG Against | Home Color Code | Away Color Code |
|---|---|---|---|---|---|---|---|---|
| Arsenal | 35 | 278 | 26 | 7.9 | 10.7 | 24.1 | #EF0107 | #d8b126 |
| Birmingham City | 32 | 351 | 38 | 11.0 | 9.2 | 41.4 | #103bce | #33333d |
| Brighton & Hove Albion | 35 | 471 | 64 | 13.5 | 7.4 | 51.9 | #0057B8 | #2c2c2c |
| Bristol City | 34 | 599 | 72 | 17.6 | 8.3 | 65.3 | #ec2128 | #1e2327 |
| Chelsea FCW | 34 | 258 | 25 | 7.6 | 10.3 | 22.7 | #034694 | #1a1d26 |
| Everton | 33 | 459 | 55 | 13.9 | 8.3 | 47.8 | #003399 | #ff584e |
| Liverpool | 33 | 478 | 54 | 14.5 | 8.9 | 44.6 | #C8102E | #7ff7ef |
| Manchester City | 36 | 397 | 24 | 11.0 | 16.5 | 35.7 | #6CABDD | #e1f1aa |
| Manchester United | 14 | 134 | 11 | 9.6 | 12.2 | 12.0 | #DA291C | #decab1 |
| Reading | 34 | 393 | 54 | 11.6 | 7.3 | 47.8 | #004494 | #b5253e |
| Tottenham Hotspur Women | 15 | 257 | 22 | 17.1 | 11.7 | 25.2 | #132257 | #28a6cc |
| West Ham United | 34 | 504 | 69 | 14.8 | 7.3 | 59.4 | #7A263A | #9fc1f3 |
| Yeovil Town | 19 | 460 | 48 | 24.2 | 9.6 | 45.5 | #4dac26 | #9d0117 |
| a Table 2: A summary of shots and goals against from the 2018-19 FA WSL |
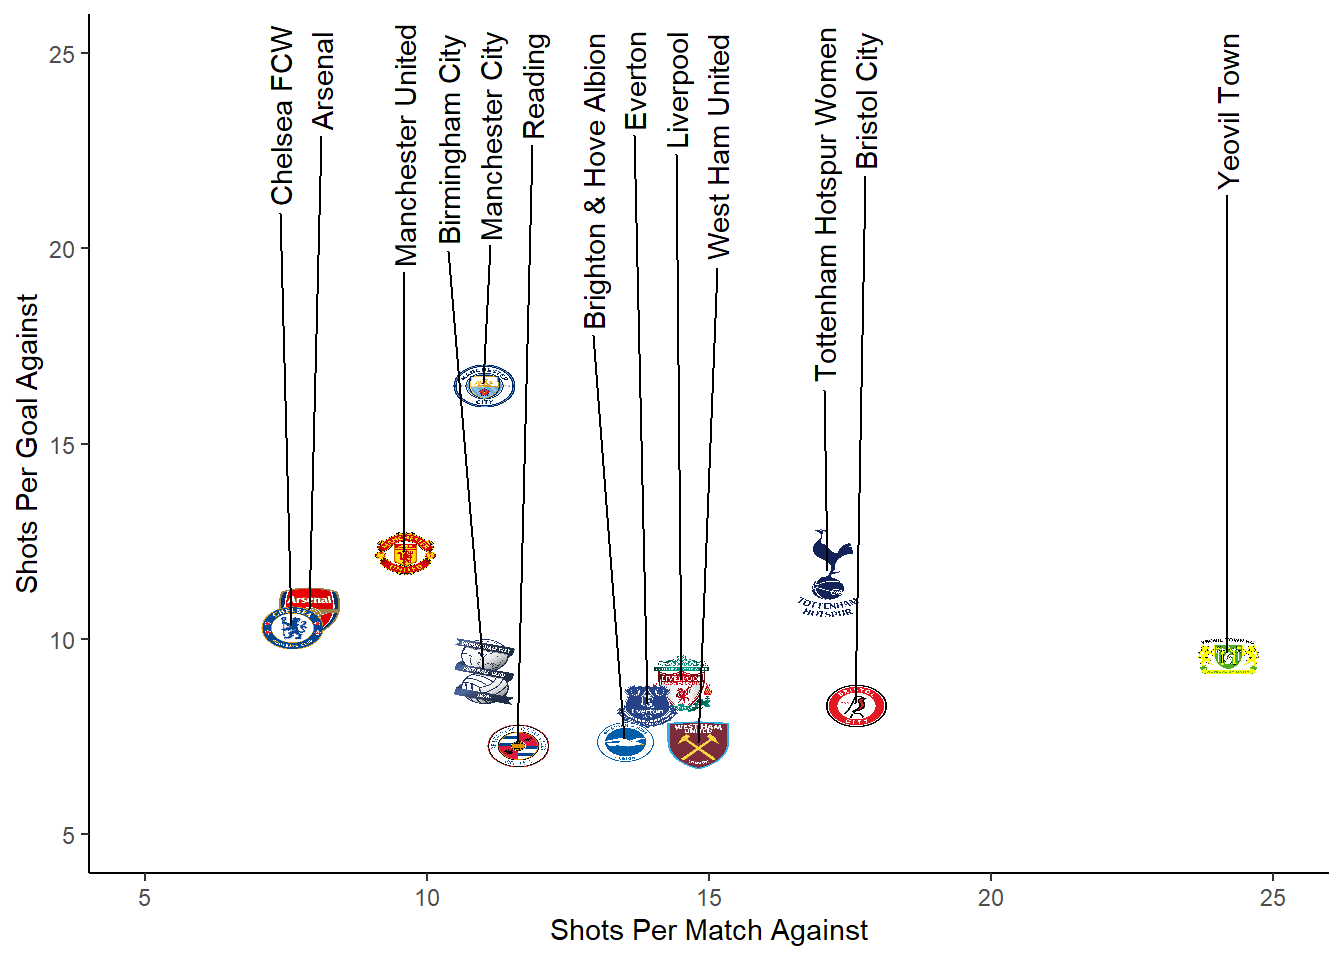
This figure again shows that some of the stronger teams were at the bottom end of this comparison. However, what it does show is that there is a similar number of shots per goal against for all teams. The main difference being the number of shots against was a differentiator between the more successful teams and less successful teams. The top four teams in the league had the least number of shots per match against compared to those who finished below them on the table.
## Warning: Removed 3 rows containing missing values (geom_image).## Warning: Removed 3 rows containing missing values (geom_text_repel).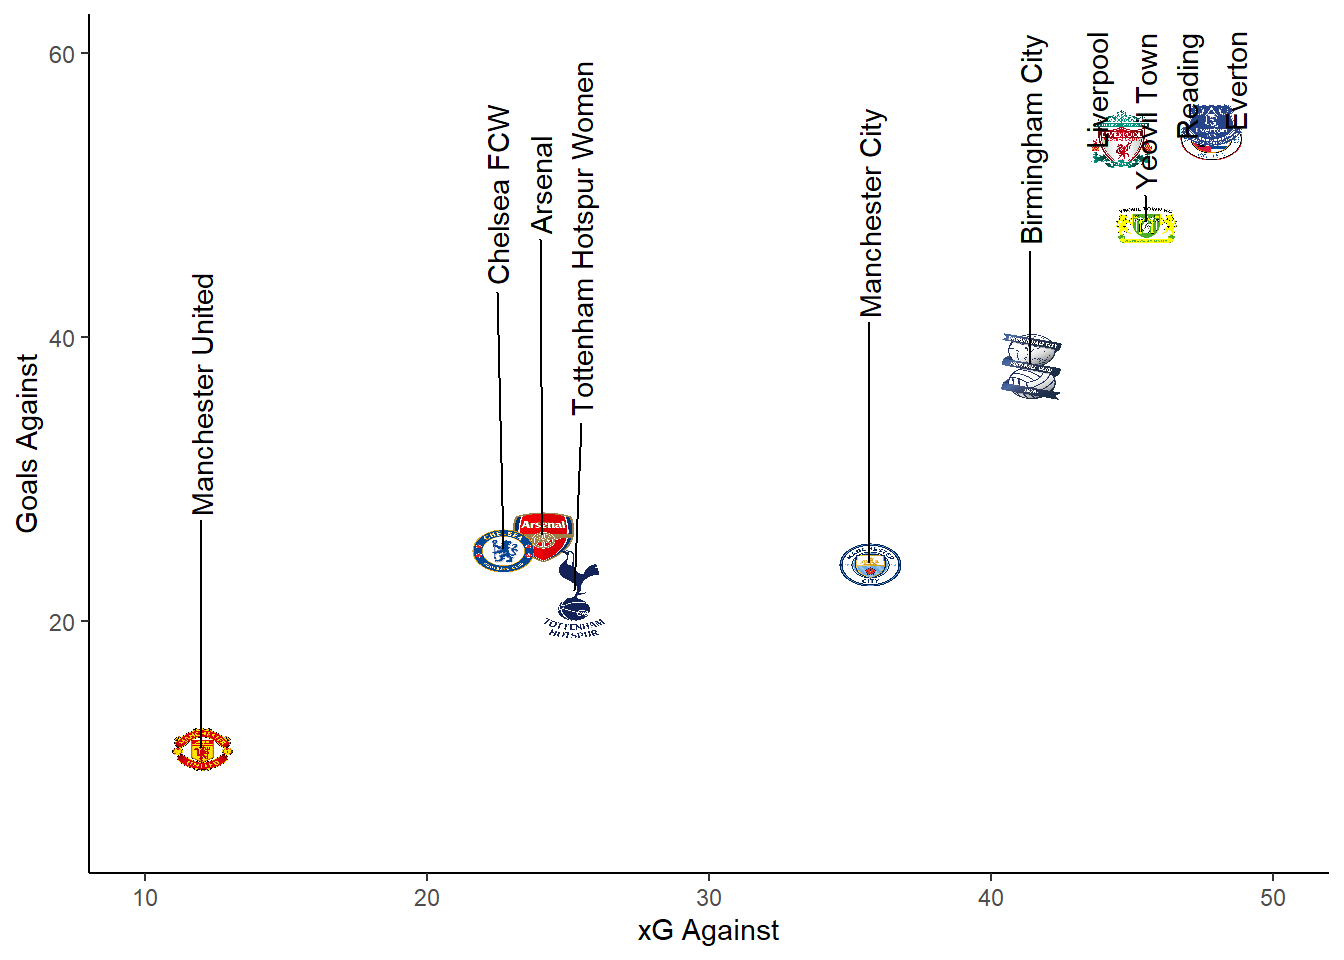
Again it is no surprise to see the better teams at the bottom left of this image. With the lowest number of goals and xG against them, these teams were defensively sound and very good in attack.
From this quick post, we can see that scatter plots are a nice way of viewing where teams fit in relation to their opposition. As long as our two metrics have some form of relationship with one another, they will often provide a lot of information.
Give it a go and thanks again to StatsBomb for providing the data for this blog post.